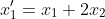
A system of differential equations contain two or more equations that are related by two dependent variables that share a single common independent variable like t for time. Applications of systems of differential equations range from engineering, science, and applied mathematics.
Consider the following system of differential equations:
First, we manually solve for a general solution of the system, then we use MATLAB to come up with a solution.
Solving for a General Solution Manually
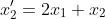
The first step is to create a coefficient matrix of the system, then solve for the eigenvalues and associated eigenvectors.
The coefficient matrix for the system is the following:

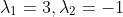
Next, the eigenvalues are solved for, which means solve for the determinant, and set it equal to zero:
By solving this, you will obtain the following eigenvalues:
Now that we have the eigenvalues, we can solve for the associated eigenvectors. This can be done by solving the following for each eigenvalue:
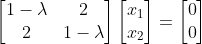
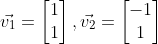
Doing so, we obtain the following associated eigenvectors:
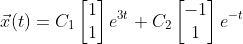
Therefore, the general solution will be the following:
Solving For a General Solution with MATLAB
First, let’s solve for the eigenvectors and eigenvalues using MATLAB. The following code will do that.
% Coefficient matrix
A = [1 2; 2 1];
% Solve for eigenvalues D and eigenvectors V
[V,D] = eig(A);
% Get the first eigenvector and scale
eigV1 = V(:,1) ./ min(V(:,1))
% Get the second eigenvector and scale
eigV2 = V(:,2) ./ min(V(:,2))
x1Vec = -1:0.05:1;
x2Vec = -1:0.05:1;
% x2 = -x1
v1 = -1*x1Vec;
% x2 = x1
v2 = x1Vec;
% Plot the eigenvectors
figure;
hold on;
plot(x1Vec,v1,'b');
plot(x1Vec,v2,'b');
xlabel('x_{1}');
ylabel('x_{2}');
grid on;
title('Eigenvectors');
% put the axes on the same limits
xlim([-1 1]);
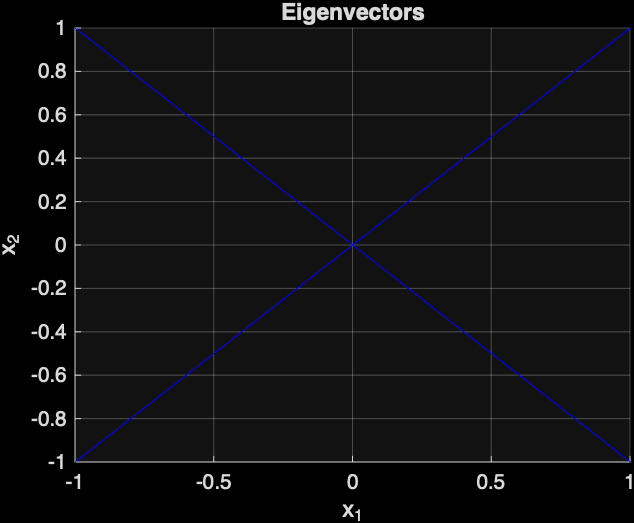
ylim([-1 1]);The following is the plot that was generated by MATLAB of the two eigenvectors:
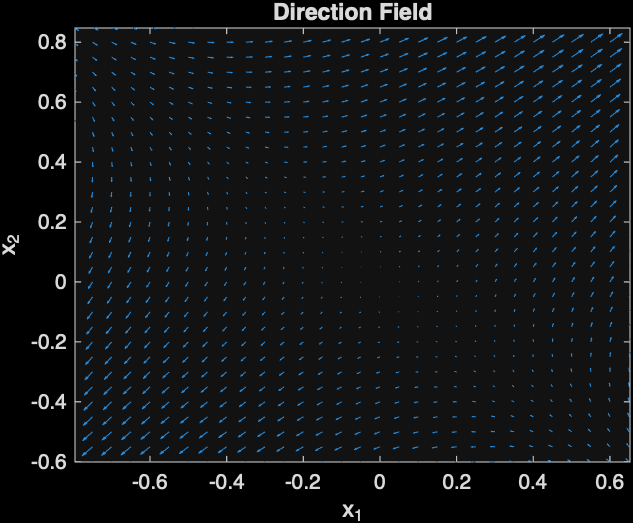
Next, let’s plot the direction field, which will show the direction of solution curves with respect to time.
The following MATLAB code will do that:
[x1, x2] = meshgrid(x1Vec,x2Vec);
% Compute the direction field at the grid of points
x1dot = x1 + 2*x2;
x2dot = 2*x1 + x2;

% The quiver command can be used to plot the direction field
figure;
quiver(x1,x2,x1dot, x2dot);
xlabel('x_{1}');
ylabel('x_{2}');
title('Direction Field');
xlim([-1 1]);
ylim([-1 1]);
The following direction field was generated by MATLAB:
Next, a phase portrait will be generated with MATLAB, which will show the relationship between x1 and x2 with respect to time. The arrows shows the point on a particular solution curve with respect to time.
figure;
streamslice(x1Vec,x2Vec,x1dot,x2dot);
title('Phase Portrait');
The following is the plot that was generated:
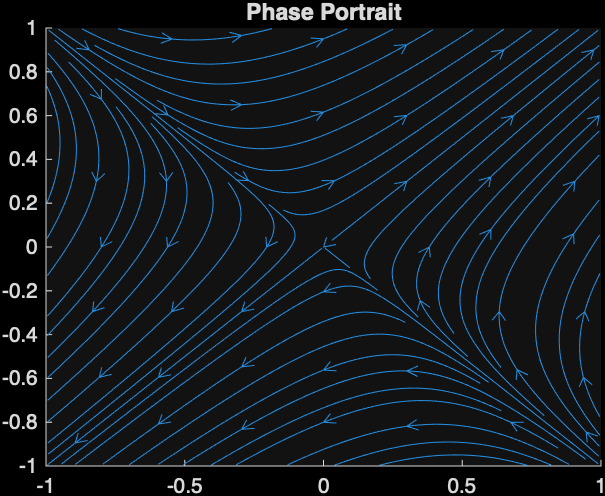
This image indicates that the point (0,0) is a saddle point. Also, you can tell that the graph will be a saddle because the eigenvalues are both real and one is positive and the other is negative.
Final Words
You saw an example of solving a system of differential equations, and you learned how to solve it using MATLAB.